Scotland’s physical activity levels

Is Scotland becoming a more physically active nation? In short, yes-ish.
In this blog post I’m going to delve into Scotland’s physical activity levels by taking a high-level look at the Scottish Health Survey data. The trend lines from this data have remained fairly stable over time - a data point in itself!
This stability, however, can make the data easy to dismiss because ‘it doesn’t add anything new’ or it ‘tells us what we already know’. But sometimes there is value in revisiting figures with a fresh perspective.
All views, analysis, and summaries in this post are my personal work and opinions. The R code for my data wrangling and plots can be found on my GitHub.
The World Health Organisation (WHO) estimates that “up to 5 million deaths a year could be averted if the global population was more active”.
The Scottish Health Survey runs every year, with the intention of monitoring the health of the nation. Participants are asked about their physical activity levels, which are then categorised into:
- meets recommendations
- some activity
- low activity
- very low activity.
In Scotland, to meet recommendations someone must do 150 minutes of moderate-intensity physical activity/week.
All the Scottish Health Survey data can be downloaded from the Scottish Health Survey data explorer.
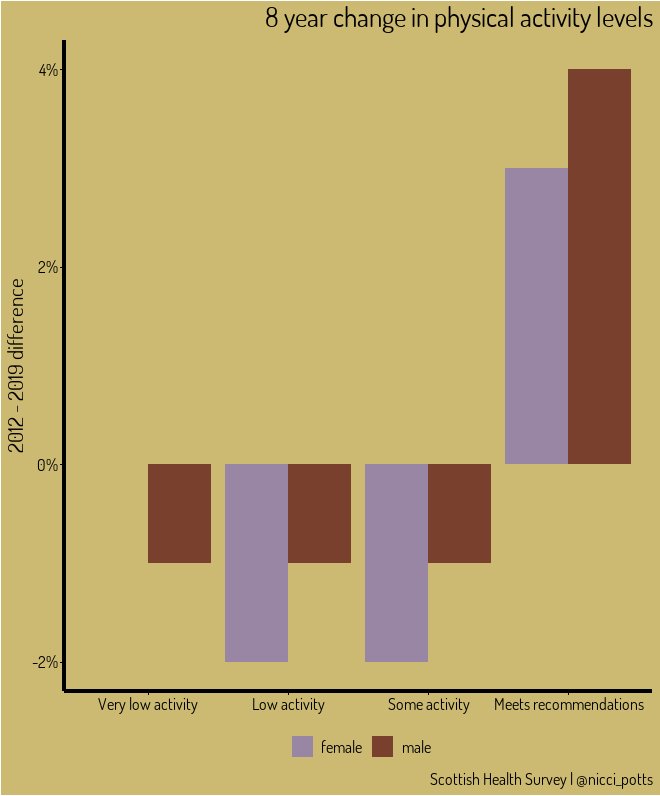
Physical activity data from the survey is available from 2012 to 2019. Over this period, the proportion of the Scottish population meeting physical activity recommendations has seen a marginal increase; with a slight difference between females and males (+3% and +4%, respectively). This equates to roughly 218,000 more people meeting physical activity recommendations in 2019 compared to 2012.
The Scottish Government estimate that low physical activity levels are attributed to 2,500 deaths/year and cost the NHS £94 million.
Great, Scotland’s become a more active nation!
Or has it?
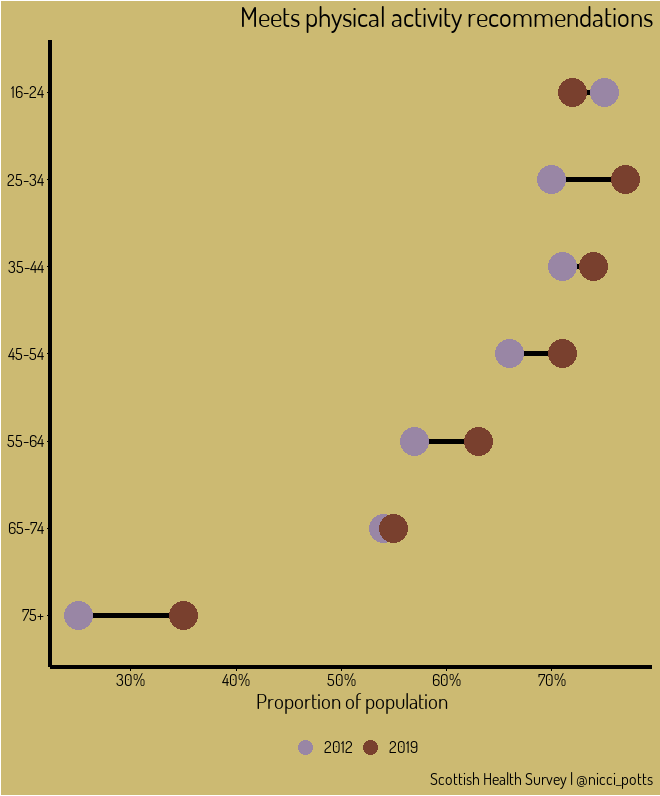
If we look at the age group breakdown for those meeting physical activity recommendations we can note:
- With the exception of the 75+ year group, there is no statistically significant change in physical activity levels across age groups between 2012 and 2019 (errors not shown in figure).
- There is a correlation between increasing age and decreasing physical activity levels - i.e. people get less active as they get older.
- The only age group with <50% meeting physical activity recommendations is the 75+ - i.e. there is a considerable age related physical activity gap.
Based on population estimates, in 2019 there were 164,500 75+ year olds meeting physical activity recommendations - an increase of 59,500 since 2012. This accounts for 27% of the overall increase; the errors on the other age groups mean we can’t breakdown the remainder of this increase.
Scaling to population, the +10% increase from 2012 to 2019 in 75+ year olds meeting recommendations has a disproportionate impact on national figures. Meaning that on a whole, Scotland hasn’t become more active but over 75’s have!
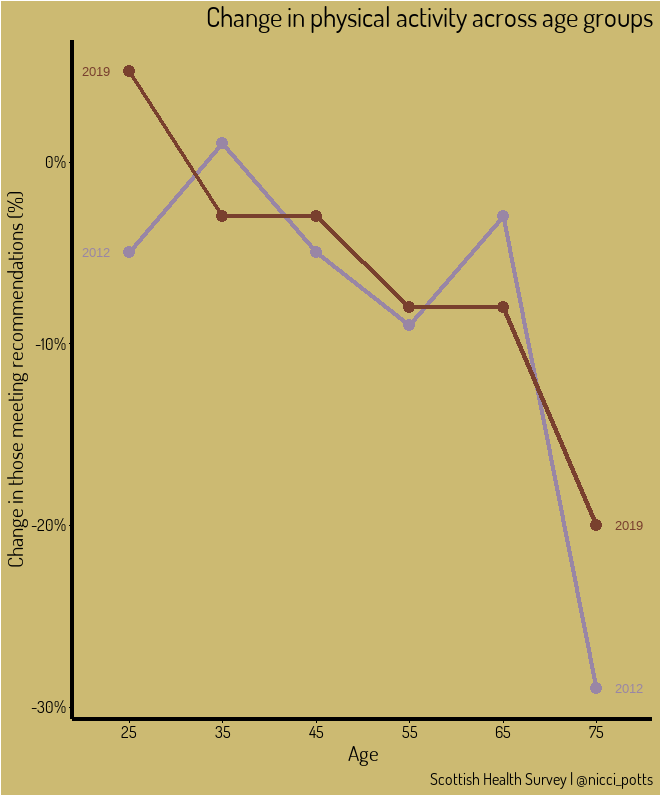
The largest drops in physical activity levels, between age groups, is between 64-74 and 75+. If we assume people don’t just stop exercising the day they hit 75, then we can infer that, although in general people become less active as they age, they are also more likely to stop meeting physical activity recommendations between the ages of 65 and 74.
The World Health Organisation recommend adults do at least 150-300 minutes of moderate-intensity physical activity or >75-150 minutes of vigorous-intensity physical activity a week, and suggest exceeding these recommendations for additional health benefits.
Research suggests that people who meet physical activity recommendations are more likely to live longer, healthier lives. Is it, therefore, fair to equate health issues alone for the large decrease in physical activity levels of 65-74 year olds?
Have there been any historic shifts in lifestyles between the 1960’s and 1970’s that could equate for people who were in their 30’s in the 1970’s having fewer health issues/being more physically active than those who were in their 30’s in the 1960’s?
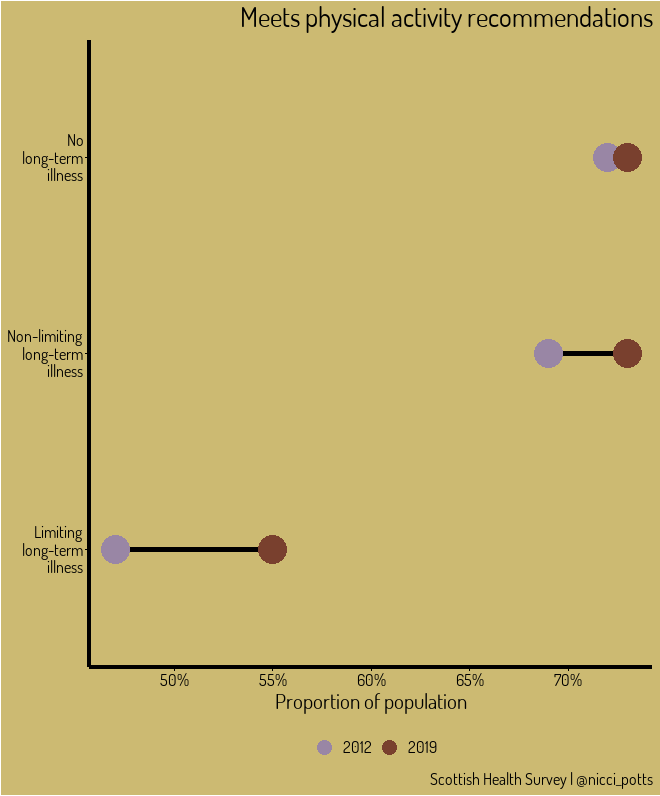
Those with a limiting long-term illness are also less likely to meet physical activity recommendations, compared to those with non-limiting and no illness. And while this data isn’t broken down by age, we also know that people are more likely to develop long-term illness with old age. It maybe unsurprising then to see similar increases in physical activity levels for people with limiting long-term illness and the 75+ age group.
That said, the proportion of those with limiting long-term illness who meet physical activity recommendations is much higher than the 75+ group (by +20%).
Scotland has an aging population. Increase in the older age groups has been much higher than younger age groups over the last 20 years. The largest increase has been in the 75+ age group (+31%).
If these increases sustain, it could indicate a shift towards higher physical activity levels in those with limiting long-term illness and older age groups. While on a whole this might not lead to a more active Scotland, it will contribute to closing the health and age related physical activity gaps - creating a more equal* landscape.
*note that I purposefully write equal and not equitable.
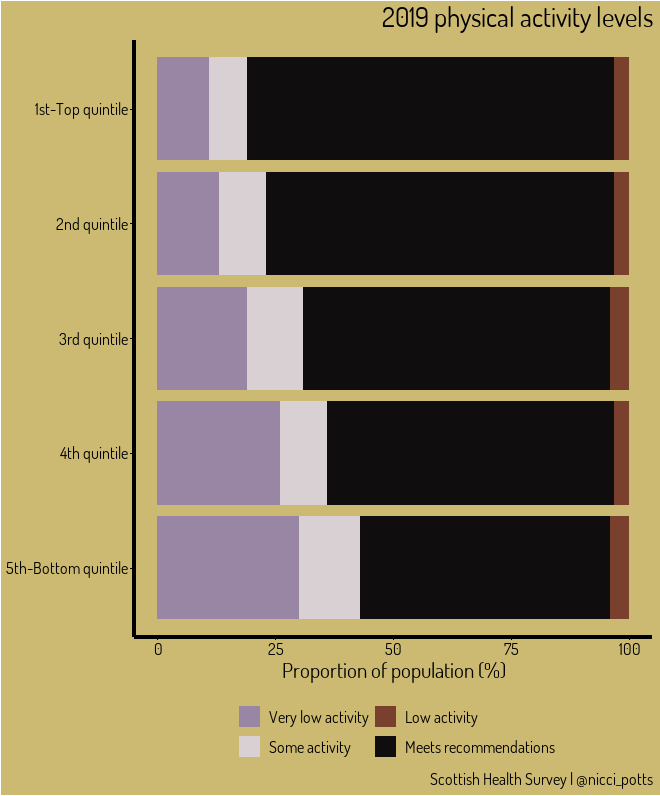
I can’t touch on an equal physical activity landscape without mentioning equivalised income. Here I am only looking at physical activity levels for 2019, where income has been separated into quintiles (1st quintile = higher earners). There are no statistically significant changes between 2012 and 2019 for any of the quintiles.
We can note:
- There is a correlation between increasing quintile and increasing proportion of those meeting physical activity recommendations - i.e. higher earners are more likely to be active.
- There is a correlation between decreasing quintile and increasing proportion of very low activity - i.e. lower earns more likely to be inactive.
- The some and low activity are small contributors; people are in general either active or inactive.
There many articles and blog posts on the privileged notion of leisure time (I recommend this blog post by Zachary Watson for a quick intro.). In short, those on lower paid incomes may have less leisure time due to working multiple jobs, non-typical shift patterns, and caring commitments. It is, therefore, unsurprising to see that lower earners are less likely to be physically active.
It is worth noting that without removing barriers and creating equality across income quintiles, when we talk about increasing physical activity levels we are, and will continue to be, talking about getting more affluent people active. This in itself is a fundamental barrier to increasing physical activity levels across Scotland. The proportion of higher earners meeting physical activity recommendations is already really high (78%), this doesn’t leave much room for improvement! To shift the national figures, Scotland will need to get lower earners more active.
People of low socioeconomic status are more likely to have poorer health and shorter life expectancy than people of higher socioeconomic status, attributed in part to a lower prevalence of physical activity. Rawal et al. 2020.
A final point worth noting is that while those meeting physical activity recommendations has increased by ~3%, between 2012 and 2019; the population of Scotland has also increased by ~2.7%.
A large contributor to population growth in Scotland is migration; and so a key question may e how much has migration impacted Scotland’s longer term physical activity trends?
To summarise:
Has Scotland become more physical activity? Maybe.
Is Scotland closing the health and age related physical activity gap? Hopefully.
Will Scotland be able to increase physical activity levels without closing the income related physical activity gap? Unlikely.
Summary image by Sergio Souza from Pexels